The NEIC: What are we talking about?
Historically the area defined as the north east inner city of Dublin (NEIC) is from Dublin Bay to the east and Drumcondra Road/ Dorset Street/Bolton Street and Arran Street East to the west.
To the south, the area is defined by the River Liffey, while to the north the border is a wide arc made up of the Tolka River to the west and all of East Wall to the east. This area is inclusive of all of Dublin 1 and parts of Dublin 3.
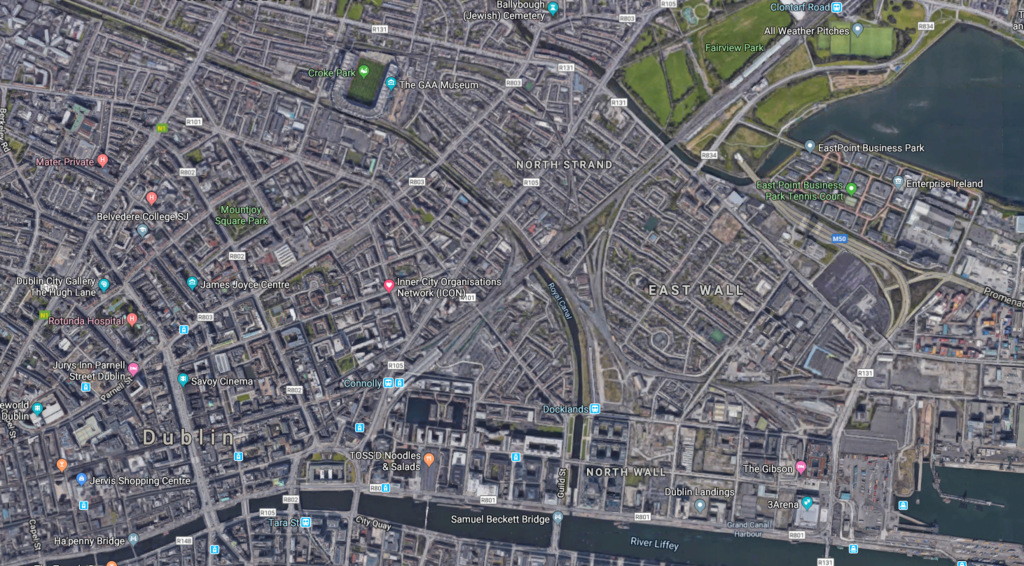
This is the wider NEIC area, within that, there are smaller distinct communitis, such as the communities of Sean McDermott Street, Summerhill, Ballybough, East Wall, North Wall, North Strand, the Five Lmaps and Mountjoy Square. There are also new community strongholds such as Parnell Street, the communties of Dominicl Street, the NCR, and the shopping and commerical districts including the IFSC and Henry Street/ MAry Street/ North Earl Street/Talbot Street as well as the historically significant O'Connell Street and Moore Street.
This is not a homogenous community but it is a community that has experienced and continues to experience disadvantage and margialisation, more saliently a series of communities that experience relatively higher levels of disadvantage than Dublin City and nationally. Key to understanding inner city communities is to be aware that the overall statistics and information on the city masks the deprivation therein and that macro average figures tell us nothing about the true experiences of the most disadvantaged.
North East Inner City: The total population of the NEIC is 45,816, a 78% increase in population 20 years.
Where are the disadvantaged populations in the NEIC?
They are in a number of key locations:
Along and around the intersection and areas of Sean McDermott St/Buckingham St. and Summerhill.
Ballybough and Popular Row areas.
Pockets at Hardwicke St/ Dorset St/ Dominick St.
- North Wall/Sherriff St.
Disadvantaged Population 16,103
Key issues and opportunities in the NEIC
The NEIC population has increased very significantly in the last 20 years. The newer populations in the NEIC area are more affluent than the indigenous populations.
The area is characterised by pockets of both high levels of disadvantaged and high levels of affluence and has marked spikes in both.
There has been significant development, particularly to the east end of the area, around the Docklands and the IFSC, with both commercial and large scale accommodation developments.
The NEIC has the largest percentage population of New Communities in Ireland. New Communities populations in areas around O’Connell St and Dorset St. are at over 50% of the population.
The area has also been the centre of significant levels of gangland crime.
Dublin Port is undergoing redevelopment.
Pobal Map of Deprivation NEIC
The Pobal HP Deprivation Index in simple terms, is a method of measuring the relative afflunece or disadvantage of a particular geographical area using data complied from census material. A scoring is given to the area based on a national average of zero and ranging from approximately -35 (being the most disadvantaged) to + 35 (being the most affluent). See colour coding below.
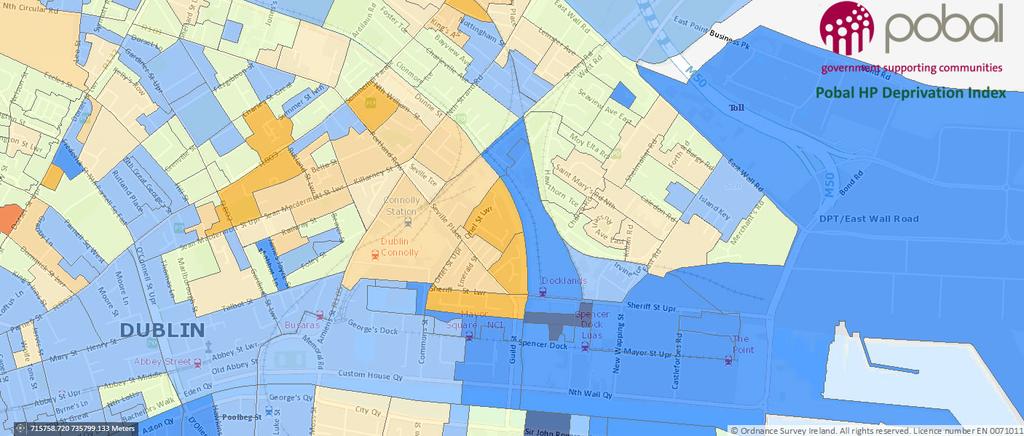
- The quadrant of the north east inner city area is make up of 11 ED’s all to the north east of the city. The 11 ED’s in this part of the city are Ballybough A, Ballybough B, Drumcondra South B, Mountjoy A, Mountjoy B, North City, North Dock A, North Dock B, North Dock C, Rotunda A and Rotunda B.
- Within the 11 ED’s there are 173 small areas, of which 24 are disadvantaged, 10 small areas are very disadvantaged and 14 small areas are disadvantaged.
- The overall deprivation score of the NEIC is 6.02, which is marginally above average, but as with all parts of the city this hides the complexity of the area.
Relative Index Score | Standard Deviation | Label | Colour Scheme |
over 30 | > 3 | extremely affluent | dark blue |
20 to 30 | 2 to 3 | very affluent | medium blue |
10 to 20 | 1 to 2 | affluent | Light blue |
0 to 10 | 0 to 1 | marginally above average | light green |
0 to -10 | 0 to -1 | marginally below average | light yellow |
-10 to -20 | -1 to -2 | disadvantaged | medium yellow |
-20 to -30 | -2 to -3 | very disadvantaged | orange |
below -30 | < -3 | extremely disadvantaged | red |